Chart.js, Canvas
Chart.js
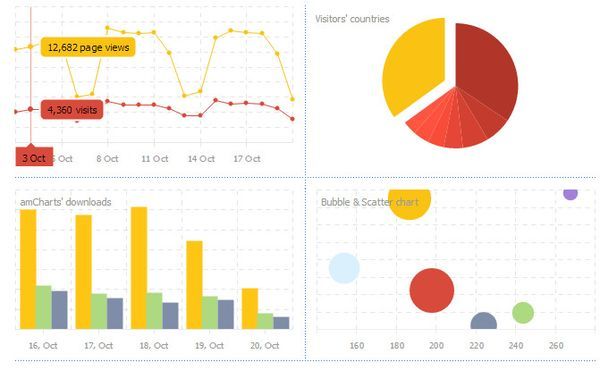
Charts.js is a library for JavaScript which uses HTMLs canvas to render various different beautiful charts for the web.
Creating a Chart
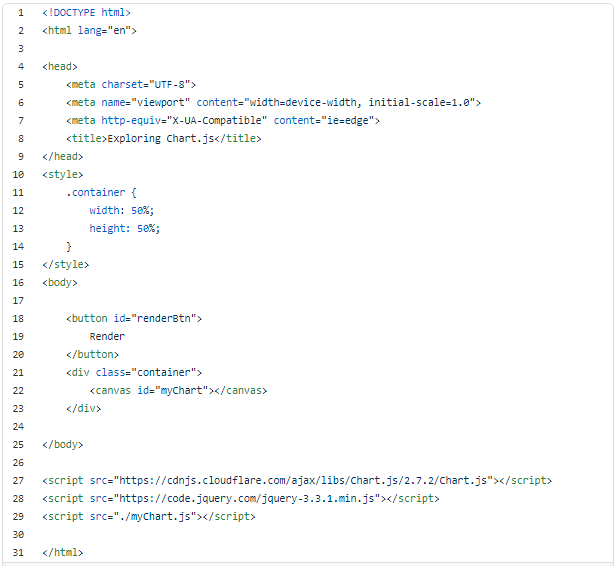
It’s easy to get started with Chart.js. All that’s required is the script included in your page along with a single < canvas> node to render the chart.
Let’s start with the index.html
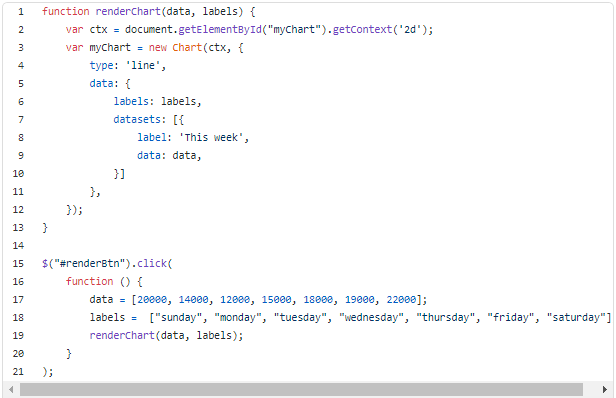
And myChart.js
You Can :
- Drawing a line chart
- Drawing a pie chart
- Drawing a bar chart
Canvas
What is HTML Canvas?
-
The HTML < canvas> element is used to draw graphics, on the fly, via scripting (usually JavaScript).
-
The < canvas> element is only a container for graphics. You must use a script to actually draw the graphics.
-
Canvas has several methods for drawing paths, boxes, circles, text, and adding images.
Canvs Info
HTML Canvas Can Draw Text
- Canvas can draw colorful text, with or without animation.
HTML Canvas Can Draw Graphics
- Canvas has great features for graphical data presentation with an imagery of graphs and charts.
HTML Canvas Can be Animated
- Canvas objects can move. Everything is possible: from simple bouncing balls to complex animations.
HTML Canvas Can be Interactive
- Canvas can respond to JavaScript events.
- Canvas can respond to any user action (key clicks, mouse clicks, button clicks, finger movement).
HTML Canvas Can be Used in Games
- Canvas’ methods for animations, offer a lot of possibilities for HTML gaming applications.
Canvas Example
